Lory
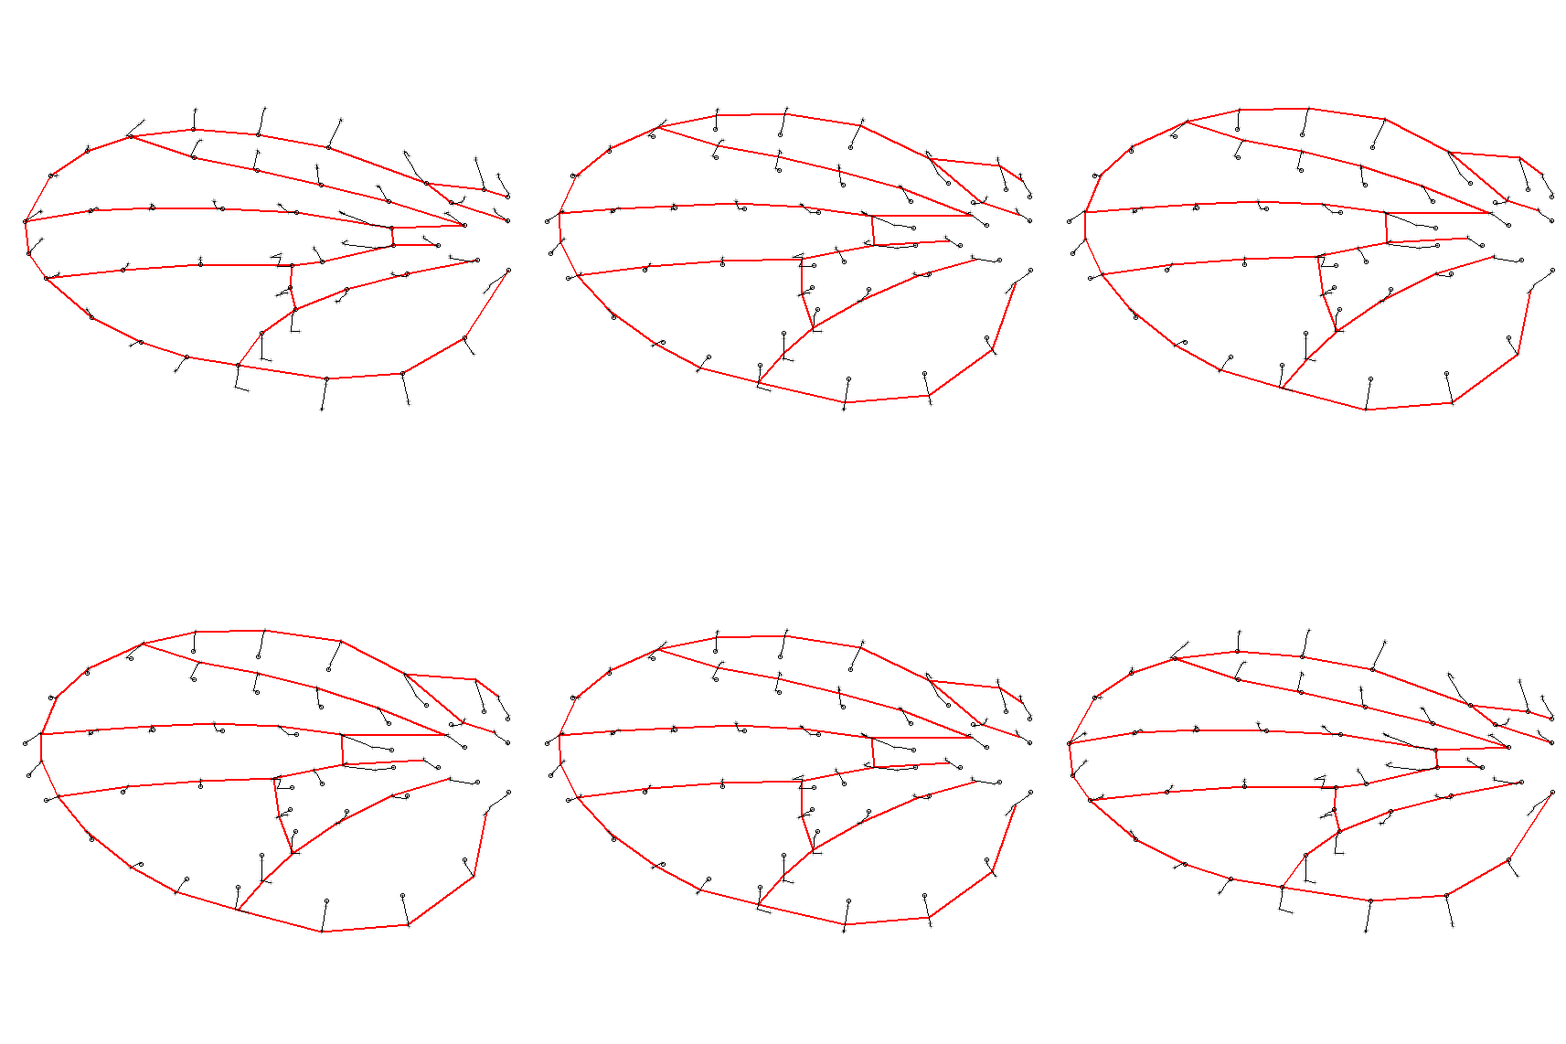
Lory reads landmark-based shape data and estimates local contractions and expansions via
model-based interpolation. It can produce several
visualizations of those changes. These include the heat map
respresentation of local expansions and contractions seen elsewhere on
this site, and movies that show shape along a gradient of changes,
like that shown below. The program is created in Matlab®.
Download the most recently compiled version (03/14/2014): 32-bit Windows||64-bit Windows
Note that Lory is currently in active development and as such new versions are posted to this site regularly. New versions are mostly intended to fix bugs, but occasionally these bugs could affect actual data outputs. A date of compilation will be always included with each release. A stable 1.0 version will be published soon; until then, please keep checking this site for updates.
A manual to use this software is included in the program package, and can be downloaded separately here: (PDF).
In order to use this program, you will need to download and install Matlab Component Runtime libraries (MCRInstaller.exe) for Windows, which can obtained from Eladio Márquez' personal website or directly from Matlab (choose appropriate 32-/64-bit MCRInstaller for version 8.1 for Windows).
Future versions are planned as the field develops and new models are integrated to this approach.
A paper introducing the approach and software has been published:
Márquez, Eladio J.; Cabeen, Ryan; Woods, Roger F.; Houle, David.2012. The measurement of local variation in shape. Evolutionary Biology, 39:419-439. doi: 10.1007/s11692-012-9159-6

This work was funded by the National Institutes of Health through the NIH Roadmap for Medical Research, Grant U54RR021813 and through National Science Foundation grant DEB-0950002. Information on the National Centers for Biomedical Computing can be obtained from http://nihroadmap.nih.gov/bioinformatics.
Download the most recently compiled version (03/14/2014): 32-bit Windows||64-bit Windows
Note that Lory is currently in active development and as such new versions are posted to this site regularly. New versions are mostly intended to fix bugs, but occasionally these bugs could affect actual data outputs. A date of compilation will be always included with each release. A stable 1.0 version will be published soon; until then, please keep checking this site for updates.
A manual to use this software is included in the program package, and can be downloaded separately here: (PDF).
In order to use this program, you will need to download and install Matlab Component Runtime libraries (MCRInstaller.exe) for Windows, which can obtained from Eladio Márquez' personal website or directly from Matlab (choose appropriate 32-/64-bit MCRInstaller for version 8.1 for Windows).
Future versions are planned as the field develops and new models are integrated to this approach.
A paper introducing the approach and software has been published:
Márquez, Eladio J.; Cabeen, Ryan; Woods, Roger F.; Houle, David.2012. The measurement of local variation in shape. Evolutionary Biology, 39:419-439. doi: 10.1007/s11692-012-9159-6

This work was funded by the National Institutes of Health through the NIH Roadmap for Medical Research, Grant U54RR021813 and through National Science Foundation grant DEB-0950002. Information on the National Centers for Biomedical Computing can be obtained from http://nihroadmap.nih.gov/bioinformatics.
