New and Improved A+ Grades: Camouflaged Bias
The slogan, “leave no child behind,” signals the current administration’s concern for Florida’s educationally disadvantaged children who are concentrated in mostly high-poverty schools. In spite of this concern, the administration, through the latest changes in school grading, has once again demonstrated its inability to deal with schools across the socioeconomic scale evenhandedly.
The latest A+ Plan rates schools for performance and improvement, using the Florida Comprehensive Achievement Test (FCAT). The Plan was to create more accountable schools, focused on improvement, particularly among under-performing children.
Unfortunately the A+ school-grading formula has “evolved” into a complex amalgam (see http://www.firn.edu/doe/schoolgrades/guide02.htm), and it is no longer obvious how well it achieves these goals, or how test results relate to school grades. Furthermore, the A+ system has raised significant concern from classroom teachers who teach under-performing students because, in many cases, student improvement in FCAT scores does not seem to be reflected in the school grade. Oddly, there does not seem to have been a serious effort to see how this Byzantine grading formula actually relates to real test results in schools across the socioeconomic scale.
This year’s school grades are based on total “Points”, which are earned in two ways. First, under the High FCAT Section, a school earns one Point for each percent of its student body testing at or above level 3 (there are five levels, with level 5 being the best) in math or reading. Of course good FCAT scores should be rewarded, but it is generally agreed that scoring this way automatically awards higher Points to more affluent schools because, in today’s world, students from poor families tend to score lower on standardized tests. This aspect is adequately covered in my 3 earlier articles (these can be found at http://bio.fsu.edu/~tschink/school_performance/).
Here, I am focusing on the second section, Annual Gains, which was introduced in part to reduce the bias of the High FCAT Section. Part A awards schools one Point for every percent of its students which “makes annual gains” in math or reading, as demonstrated in any one of three ways: (1) improvement in level (for example, from level 3 to level 4), (2) staying in a higher level (i.e., levels 3, 4, or 5), or (3) demonstrating more than one year’s growth in test scores within levels 1 or 2. Finally, in the Part B of the Annual Gains Section, special attention is given to the lowest 25% of a school’s readers. For every percent of this group that makes more than one year’s progress, the school is awarded one Point.
My statistical data analysis of over 800 schools in six large Florida school systems shows that the assigned Annual Gains Points are only weakly, or not at all, related to the change in average test scores or the increase in higher-level students. Most worrisome, schools with the poorest students are often penalized by the strange data manipulations that determine Annual Gains.
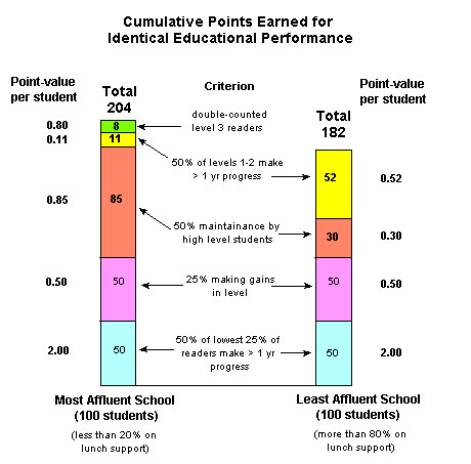
Here is an example, illustrated in the accompanying chart. Imagine two schools, each with 100 students. Our most affluent school (MAS) is in a middle-class neighborhood. Fewer than 20% of its students receive lunch support (a measure of family poverty). Our least affluent school (LAS) is in a poor neighborhood--- more than 80% of its students receive lunch support. In Leon County, 85 children in MAS and 30 children in LAS read and do math at level 3 or higher. Let us assume that the two schools perform their jobs equally well, and that 50% of these higher-level readers and mathematicians maintain their level. Annual Gains (Part A) assigns 85 Points (42.5 each in math and reading) to MAS. The same performance earns the LAS only 30 Points. Next, assume that another 25% of the students in each school improved by one level earning 50 Points for both schools, and that of those students in level 1 or 2 that did not rise in level, half demonstrated more than one year’s growth in both math and reading. This earns MAS 11 Points (4 rose in level and have been counted already), and LAS, 52.
In both schools, half of the lowest 25% of readers made more than one year’s progress. Annual Gains, Part B gives each 50 unbiased Points. However, in MAS, the lowest 25% of readers includes 10 level 3 readers because there are only 15 level 1 and 2 readers in this school. The MAS has already been awarded 8 Points for these level 3 readers under Annual Gains (Part A), and now receives still more Points for these very same students. LAS gets no such advantage of double counting because all of the lowest 25% of its readers are in levels 1 and 2.
Adding these points, we find that for the same performance, MAS earned 204 Annual Gains Points and LAS 182, a difference of 22 Points. Are these 22 Points a big deal? You bet! The average Florida “F” school earned 260 Points, but needed only 20 more Points to earn a D. Twenty Points would also have brought the average D school (300 Points) up to a C. Clearly, the 22 Points would have raised each a whole letter grade. In fact, given a 20-Point increase, half of Florida’s F schools would receive a D, and half of the D schools a C. Try telling each of the D or F schools that was denied a well-deserved higher grade that 22 Points do not matter.
Similar calculations across the observed performance range among Florida schools show that the grading system is biased throughout. Although there are some performance combinations that bias Annual Gain Points in favor of high poverty schools, the bias is usually against them. As a consequence, many schools serving a less affluent population have been graded lower than they deserve and many more affluent schools higher. In addition, this system prevents us from identifying schools that are actually making improvement, and robs us of knowledge of what really works.
Standardized tests can provide a great deal of information on student achievement and progress. When test results are manipulated in complex, poorly understood ways such as the well-intentioned “Annual Gains”, there are often unintended consequences. At its inception, the A+ Grading Plan was biased against schools with poorer students. Now, while advertising that the bias has been reduced by using test score gains, the administration has actually increased this bias, giving the teachers and principals who deal with our under-performing children, the very ones whom the administration is attempting to help, another (often undeserved) whack upside the head.
Dr. Walter R. Tschinkel is the Menzel Professor of Biology at Florida State University. His articles on understanding school performance have appeared in several Florida newspapers.