1997. Phylogenetic analysis of phenotypic covariance structure. I. Contrasting results from matrix correlation and Common Principal Component analyses. Steppan, S.J. Evolution. 51(2):571-586. |
1997. Phylogenetic analysis of phenotypic covariance structure. I. Contrasting results from matrix correlation and Common Principal Component analyses. Steppan, S.J. Evolution. 51(2):571-586. |
Applications of quantitative techniques to understanding macroevolutionary patterns typically assume that genetic variances and covariances remain constant. That assumption is tested among 28 populations of a species group. Phenotypic covariances are used as a surrogate for genetic covariances to allow much greater phylogenetic sampling. Two new approaches are applied that extend the comparative method to multivariate data. The efficacy of these techniques are compared, and their sensitivity to sampling error examined. Pairwise matrix correlations of correlation matrices are consistently very high (>0.90) and show no significant association between matrix similarity and phylogenetic relatedness. Hierarchical decomposition of common principal components (CPC) analyses applied to each clade in the phylogeny rejects the hypothesis that common principal components structure is shared in clades more inclusive than subspecies. Most subspecies also lack a common covariance structure as described by the CPC model. The hypothesis of constant covariances must be rejected, but the magnitudes of divergence in covariance structure appear to be small. Matrix correlations are very sensitive to sampling error, while CPC is not. CPC is a powerful statistical tool that allows detailed testing of underlying patterns of covariation.
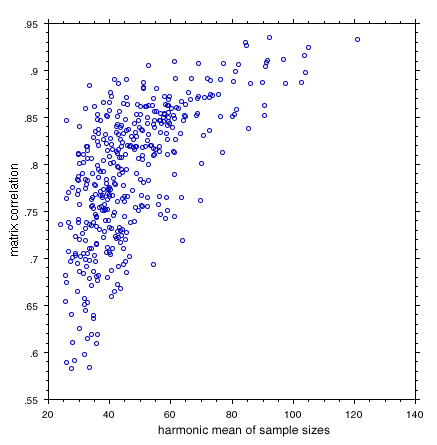
Figure 4. Plot of all possible pairwise matrix correlations among population correlation matrices for 24 variables. This graph demonstrates the overriding effect of sampling error on the estimation of matrix correlations. Corrections for sample size are required.
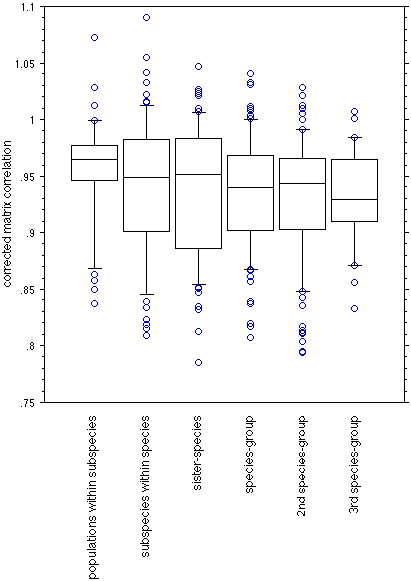
Fig. 7. Matrix correlations, partially corrected for sample size, of all possible pairwise comparisons, categorized by the phylogenetic relationship of the population pairs. Bars indicated the 10, 25, 50, 75, and 90 percentiles. Circles represent individual outliers.
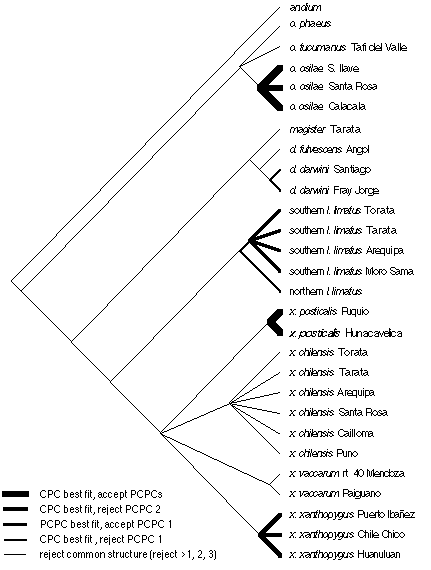
Figure 8. Common principal components analysis of shared hierarchical structure in covariance matrices. Thicker lines indicate clades sharing common structure higher in the hierarchy of matrix associations. For most clades, one must reject at least the first three partial common principal components.