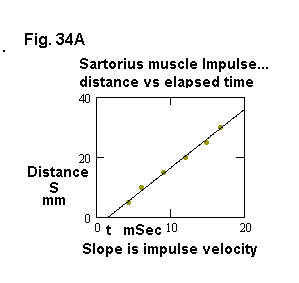
Each distance was set, and the corresponding AP was recorded, following a single stimulus pulse at S. Operationally, the distance is therefore the independent, and latency to spike the dependent variable, because the latency depends of the distance. Mathematically, the independent variable is customarily represented by the X, horizontal axis, in an X-Y plot. The velocity is defined as the slope of a curve showing distance as a function of time, so the plot is constructed to show elapsed time as the independent variable. By using many points, we reduce the error that would arise if the time between only two points were used. The velocity in this instance is about 2 m/sec. Compare with nerve impulse velocity (Topic 23).

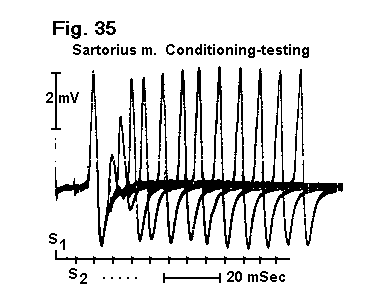
The recovery period of the sartorius muscle is determined by the response
of the muscle to a pair of stimuli separated by successively increased
C-T interval. The response to the first shock is the same for each test,
but that to the second is diminished according to the interval between
first and second shocks of each pair.
Fig. 35 Sartorius refractory (recovery) period.
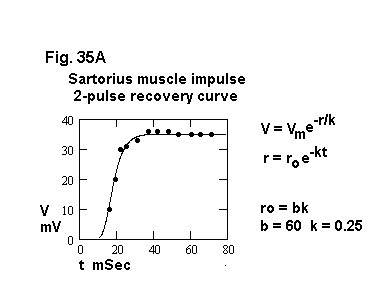
After the first stimulus (S1, conditioning), a second (S2, testing) stimulus evokes at a short interval a smaller response than the first. At longer intervals, the second response increases.

The data are predicted by a decelerating exponential growth function.
Envoie: Compare and contrast muscle and n-m properties (Topics 31-35) with those of nerve (Topics 13-30).